The last 10 years produced a period of dominance from growth stocks largely driven by a handful of United States organizations. These businesses, often referred to as Big Tech or FAAMG (Facebook, Amazon, Apple, Microsoft and Alphabet [Google]) stocks were some of the best performers in the 11-year bull market ending in March and the subsequent bear-market earlier this year.
Following years of strong returns, some investors are increasingly comfortable holding a few large-capitalization equities, extrapolating recent performance while overlooking the risk of highly concentrated equity portfolios.
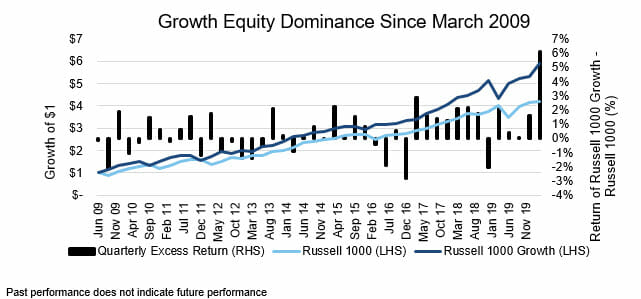
Growth stocks have outperformed the broad market in recent years. Since 2009, the Russell 1000 Growth Index produced greater returns than the Russell 1000 Index in eight of the past 11 years and from March 2009 through March 2020 generated a 99 percent higher cumulative return.
While many investors have expected the emergence of slower growth, relatively less expensive stocks, growth equities[1] asserted their dominance during the first quarter, generating a 6.1 percent return above the broad market[2] – the third largest magnitude of quarterly outperformance since 1979.

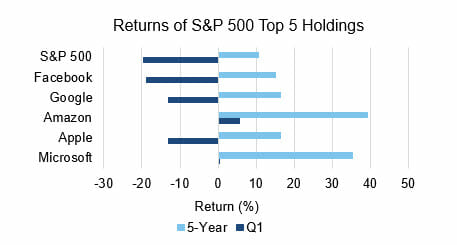
The largest capitalization stocks in the U.S. – FAAMG – majorly contributed to the strong returns of growth indices. Demonstrating the dominance of these businesses, which we will refer to as “Big Tech”:
• All of these companies outperformed the S&P 500 in the first quarter, producing an average decline of 6.1 percent, compared to the 19.6 percent decline for the S&P 500
• Each stock outperformed the S&P 500 over the trailing five-year period ending in March

As a result of these impressive returns and the large market capitalization of each stock, this group has contributed roughly half of the return of the S&P 500 over trailing three- and five-year periods . As Big Tech stocks price rise, their weighting in the S&P 500 reached an all-time double digit high of nearly 21 percent. Given the high earnings growth of Big Tech, these stocks have a greater representation in growth indices and subsequently, have driven the outperformance of that market segment.
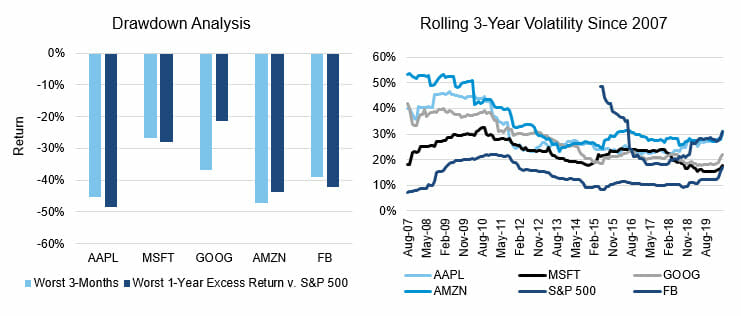
The dominance of Big Tech has led many investors to question the need for diversification outside of these securities. A historical assessment shows investors may be exhibiting a recency bias, focusing too much on recent performance and overlooking potential risk. The following data points highlight some of the risks surrounding Big Tech stocks:
• Over rolling one-year periods since 2005, underperformance of Big Tech stocks versus the S&P 500 ranging from -21 percentage points for Google to -48 percentage points for Apple
• A drawdown at least 15 percentage points larger than the S&P 500 over rolling three-month periods since 2005 for each stock, with the exception of Microsoft
• Average volatility over rolling three-year periods since 2007 ranging from 71 percent to 156 percent higher than the volatility of the S&P 500

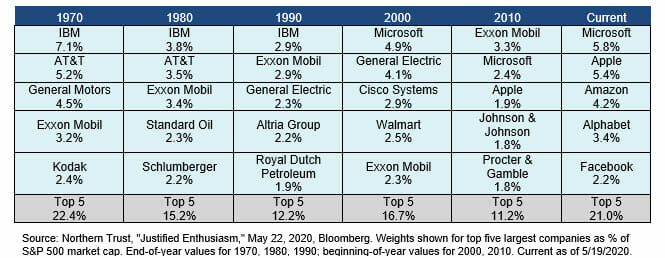
A historical examination of the largest capitalization stocks provides valuable perspective. The chart below depicts the top five holdings of the S&P 500 as of the last six decades. The limited persistence of stocks in the top five from one decade to the next illustrates the often fleeting dominance of the largest capitalization companies as new technology, changes in consumer preferences and regulation often impair competitive advantages that were once thought to be impenetrable.

The recent dominance of the largest market capitalization stocks in the U.S. has led some investors to feel a false sense of security in holding a concentrated portfolio of those securities. While these businesses have dominant competitive positions, a historical assessment of risk shows the tendency for single-stock positions to trade with much higher volatility than the market and eventually experience significant periods of underperformance.
Additionally, history shows limited persistence in the largest capitalization stocks generating the returns necessary to retain their top five market-capitalization positions, demonstrating the difficulty businesses have in maintaining decade-long periods of dominance. With Big Tech stocks representing an all-time high weight in the S&P 500, investors must realize the already significant exposure present in broad market indices.
To this end, as detailed in our recent paper, “The Next Chapter in the Active vs. Passive Debate,” we believe deploying active management in areas showing the greatest history of success, while diversifying across market capitalization, sectors and styles will increase the probability of investors achieving their objectives.
[1] Represented by the Russell 1000 Growth Index
[2] Represented by the Russell 1000 Index
The information contained herein is confidential and the dissemination or distribution to any other person without the prior approval of Fiducient Advisors is strictly prohibited. Information has been obtained from sources believed to be reliable, though not independently verified. Any forecasts are hypothetical and represent future expectations and not actual return volatilities and correlations will differ from forecasts. This report does not represent a specific investment recommendation. The opinions and analysis expressed herein are based on Fiducient Advisor research and professional experience and are expressed as of the date of this report. Please consult with your advisor, attorney and accountant, as appropriate, regarding specific advice. Past performance does not indicate future performance and there is risk of loss.


