
High valuations come with high expectations. U.S. equity markets step back on growth concerns.
Key Observations
• Growth Scare Hits Risk Assets – Weaker economic data, a patient Fed and shifting policy dynamics fueled slowdown fears triggering a broad selloff of U.S. equities, with defensive sectors outperforming.
• Growth Puts Spotlight on Valuations – High-valuation stocks fell more than peers, while value and defensive sectors led. Consumer staples outperformed consumer discretionary by 11%, while Treasuries rallied amid shifting markets sentiment.
• International Extends its Lead – EAFE took another step forward and added to its 2025 lead over the S&P 500, led by EU financial and defense spending along with a cooling of U.S. high valuation stocks.
Market Recap
Shifting policy dynamics, a patient Federal Reserve holding rates steady and weaker economic data have left markets questioning the strength of future growth. These concerns were amplified when the Atlanta Fed’s GDPNow estimate turned negative for the first time since 20221. While the estimate may have been skewed by a rush of inventory builds in January ahead of the new administration and potential tariffs (remember import spend negatively impacts GDP), it still unsettled investors. Further fueling anxiety, real consumer spending fell by -0.5%, and consumer sentiment posted its sharpest decline since August 2021, dropping from 105.3 to 98.32. Investor sentiment quickly turned negative, triggering a broad selloff in February across many risk assets.
A slowdown in U.S. growth raises questions about the lofty valuations currently assigned to equities. Markets reflected this shift, as stocks and sectors “priced for perfection” suffered steeper declines than their lower-valuation peers. As a result, defensive sectors and assets outperformed. Value stocks led growth stocks and defensive sectors outpaced speculative ones—most notably seen in the nearly 11% performance gap between consumer staples (defensive) and consumer discretionary (speculative).
The Magnificent 7 pulled back sharply, with Tesla leading the decline, down nearly 30% for the month. Bitcoin—an asset we often view as a proxy for investor risk appetite—fell nearly 20% from recent all-time highs. In fixed income, Treasuries rallied, particularly long-duration assets. The 10-year yield, which was approaching 5% not long ago, is now closing in on 4%3.
Meanwhile, international equities extended their 2025 lead, with EAFE outperforming the S&P 500 by approximately 6% year-to-date. European financials and services, particularly defensive stocks, contributed to these gains. The shift in U.S. policy toward EU military support and rising defense spending across European nations further bolstered these sectors. Given these developments—and many of the investor conversations we’ve had to start the year—we turn our focus to a key theme: U.S. versus international markets.
Trees Don’t Grow to the Sky
Over the past several weeks, we have had the opportunity to connect with many of you regarding our updated Capital Market Assumptions and 2025 allocations. A recurring theme in these discussions has been the assumption that U.S. equity outperformance is a foregone conclusion. Here is the rub—when something is a “given” in markets, it can often be more profitable to take the other side of that trade. Rather than listing all the reasons why we are skeptical of this foregone conclusion, let us take the assumption at face value and assume the next decade is just like the last – and see where it leads.
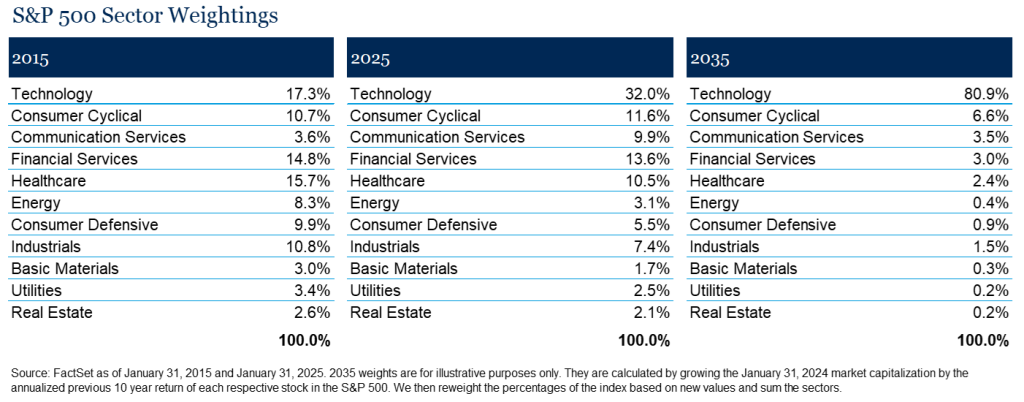
The period from 2015 to 2025 was extraordinary for markets, particularly for a select group of companies. Seventy-three firms in the S&P 500 sustained annualized returns exceeding 20%, well above historical norms. Many of these belonged to the technology sector, benefiting from powerful AI tailwinds that have contributed to today’s unprecedented market concentration. The challenge is that trends often seem obvious while they are occurring. However, stepping back and doing the math shows why the saying “trees don’t grow to the sky” exists. If the past decade’s trends were to repeat, the technology sector would comprise 81% of the S&P 500 by 2035—a level as unrealistic as it is striking.
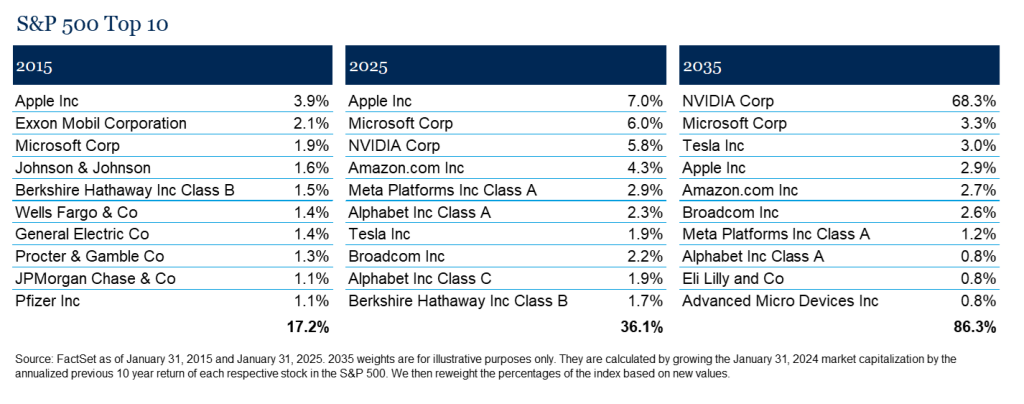
Consider NVIDIA, a prime example of how sustained meteoric growth runs into mathematical constraints. In 2015, NVIDIA ranked 374th in the S&P 500 with a mere 0.06% index weight, despite having joined the benchmark more than a dozen years earlier. Over the past decade, an astonishing 74% annualized return has propelled it to a 5.8% weight, fueled by unprecedented AI-driven demand for its chips. If NVIDIA were to replicate that performance over the next ten years, it would balloon to 68% of the S&P 500 by 2035—an outcome that underscores the limits of extrapolating past trends indefinitely.
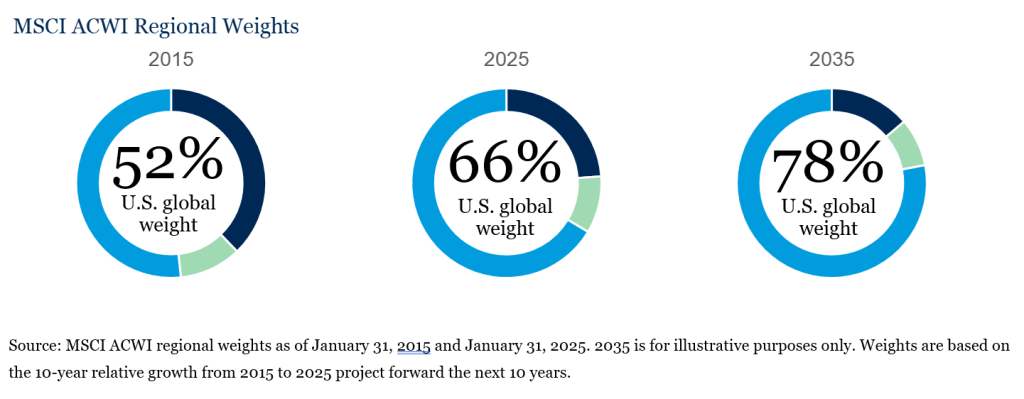
Zooming out, if global economic trends also mirrored the past decade, the U.S. economy would shrink as a share of global GDP, yet U.S. equity markets would account for the vast majority of global value—a disconnect that challenges conventional assumptions about long-term sustainability.
Outlook
This is not our forecast—nor should it be for any prudent investor. It is also not a call for technology or NVIDIA to falter. Technology remains a critical sector, warranting a significant market share, and NVIDIA’s success is well-earned, reflecting exceptional execution amid surging AI demand. However, when investors treat U.S. outperformance as inevitable, they implicitly assume a continuation of these extreme trends. And, as history has taught us, markets rarely move in straight lines. So, as we set our gaze forward for the next decade of allocations, let us remain mindful that even the tallest trees cannot grow forever.
The information contained herein is confidential and the dissemination or distribution to any other person without the prior approval of Fiducient Advisors is strictly prohibited. Information has been obtained from sources believed to be reliable, though not independently verified. Any forecasts are hypothetical and represent future expectations and not actual return volatilities and correlations will differ from forecasts. This report does not represent a specific investment recommendation. The opinions and analysis expressed herein are based on Fiducient Advisor research and professional experience and are expressed as of the date of this report. Please consult with your advisor, attorney and accountant, as appropriate, regarding specific advice. Past performance does not indicate future performance and there is risk of loss.