
A back-to-the-basics look at allocating capital efficiently
Key Observations
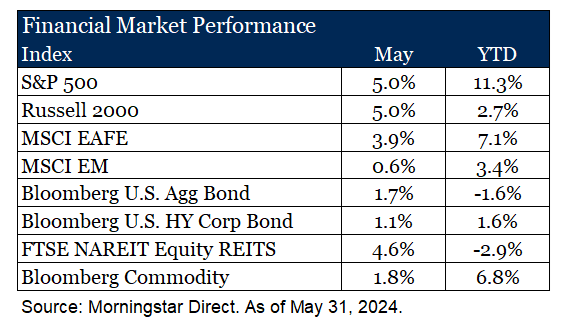
• A fixation on the direction of interest rates continues to drive prices in the short term, including in May. Rates moved lower, pushing rate-sensitive asset classes ahead of their peers.
• However, we take this opportunity to step back from the short-term focus on rates and discuss the findings of our latest long-term study on the efficient allocation of active and passive investing.
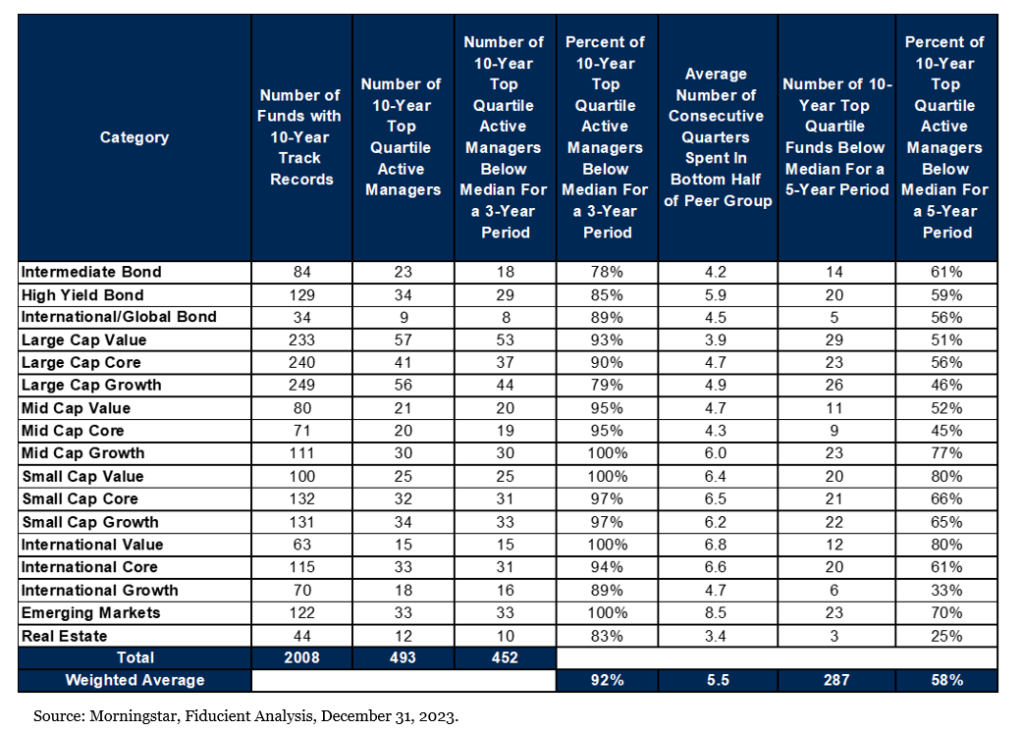
• Notably, 92% of 10-year top-quartile managers spent at least one 3-year period in the bottom half of their peer group, highlighting that success is not linear. We have also added nuance to our review of efficient allocation in markets most likely and profitable to engage in active investing.
Market Recap
Rates, rates and more rates. Perhaps an over-stylized narrative, but the market is clearly fixated on the direction of rates and the potential for a Fed rate cut. In May, rates moved lower, and there was a modest shift in Fed policy with a slowing of Quantitative Tightening, while maintaining the policy rate. As a result, more rate-sensitive sectors gained ground for the month, with longer-duration bonds outperforming cash, small caps in line with large caps, and REITs shining among real assets.
Despite these shifts, the S&P 500 managed to post a new high during the month, driven by continued exuberance around a few choice names that benefit from the intense focus on Artificial Intelligence. Despite the price increase, Q1 earnings season was favorable, leaving valuations relatively flat month-over-month at around 20x forward earnings. This remains at the upper end of the 20-year range, excluding the extraordinary spike seen around COVID due to the nuances of live prices and dated earnings. With 98% of companies reporting earnings, 78% have surprised to the upside, and earnings grew at a blended rate of 5.9%1.
Revisit the Basics – Active & Passive
Since 2007, we have delved into the data behind active and passive investing, always in pursuit of efficient portfolio allocations. While this is not a new debate, the discussion has often turned dogmatic over the years. Some believe that passive investing is the only efficient approach, while others argue that active investing offers unique opportunities, leaving little room for middle ground. However, intellectual honesty allows us to consider both perspectives simultaneously.
Our latest study embraces this nuanced approach to allocation, reaffirming that pragmatism and patience are the keys to success. Let’s begin with patience. After all, it is indeed a virtue. With respect to the selection of active managers, “top quartile” performance is often the goal. Our most recent study, along with the seven preceding it, continue to confirm that the path to success is not linear. Often, top-quartile managers face adversity along the way. Our latest 10-year review shows that 92% of top quartile managers over a ten-year period experience at least one three-year period where their results fall into the bottom half of their peer group. This trend has remained consistent over time, with figures ranging from the low 80s to our most recent study that concludes the number is now in the low 90s.
As the table illustrates, the cyclical path to success is not unique to any particular investment style, geography, or asset class. If you take away one thing from this paper, let it be the importance of patience. Without it, we risk falling prey to the trap of selling low and buying high—a true capital-destroying quagmire.
Now, let’s talk pragmatism. Cognitive dissonance refers to the mental discomfort that comes from holding two seemingly conflicting beliefs at once. Yet in this discomfort, at least in this instance, underlies the opportunity in our opinion.
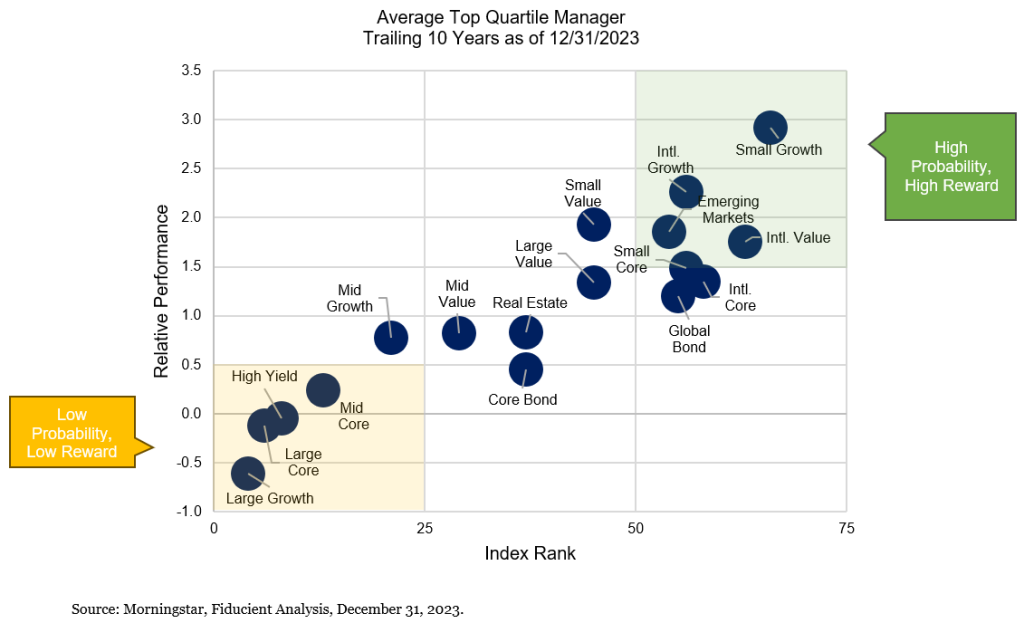
Our most recent study underwent enhancements to add context to this discussion. Below, we graphically and mathematically illustrate a simple concept. The x-axis represents the likelihood of outperforming the index—the higher the rank of the index, the lower the probability of selecting a manager who beats it. The y-axis represents the payoff, or lack thereof, in selecting a top-quartile manager.
To bring these ideas together, we like to use the analogy of a dartboard. The x-axis is the size of the dartboard: if we close our eyes and throw a dart, the larger the dartboard, the higher the probability of hitting it. The y-axis is the payoff for hitting the bullseye: if the payoff is low, we’re unlikely to invest time and energy in practicing and playing. If the payoff is high, it’s worth the effort.
In our view, investors are most efficient with their capital by allocating actively in asset classes in the upper right quadrant of this graphic, rather than the bottom left. Is it perfect? No. As noted earlier, the truth often lies in shades of gray. For example, the high-yield fixed income index (bottom left) is effectively non-investable, and passive equivalents rarely match the index’s return, making the case for active. There are other examples where additional thought is required. That said, absent other information, following this rubric leads to a higher likelihood and magnitude of success.
For much greater depth on this topic see our most recent study, The Next Chapter in the Active vs Passive Debate.
For more information, please contact any of the professionals at Fiducient Advisors.
1Factset Earnings Insight, May 31, 2024.
Disclosures & Definitions
Comparisons to any indices referenced herein are for illustrative purposes only and are not meant to imply that actual returns or volatility will be similar to the indices. Indices cannot be invested in directly. Unmanaged index returns assume reinvestment of any and all distributions and do not reflect our fees or expenses.
- The S&P 500 is a capitalization-weighted index designed to measure performance of the broad domestic economy through changes in the aggregate market value of 500 stocks representing all major industries.
- Nasdaq Composite Index includes all domestic and international common type stocks listed on the Nasdaq Stock Market.
- The S&P 500 Equal Weight Index (EWI) is the equal-weight version of the widely-used S&P 500. The index includes the same constituents as the capitalization weighted S&P 500, but each company in the S&P 500 EWI is allocated a fixed weight – or 0.2% of the index total at each quarterly rebalance.
- Russell 2000 consists of the 2,000 smallest U.S. companies in the Russell 3000 index.
- MSCI EAFE is an equity index which captures large and mid-cap representation across Developed Markets countries around the world, excluding the U.S. and Canada. The index covers approximately 85% of the free float-adjusted market capitalization in each country.
- MSCI Emerging Markets captures large and mid-cap representation across Emerging Markets countries. The index covers approximately 85% of the free-float adjusted market capitalization in each country.
- Bloomberg U.S. Aggregate Index covers the U.S. investment grade fixed rate bond market, with index components for government and corporate securities, mortgage pass-through securities, and asset-backed securities.
- Bloomberg U.S. Corporate High Yield Index covers the universe of fixed rate, non-investment grade debt. Eurobonds and debt issues from countries designated as emerging markets (sovereign rating of Baa1/BBB+/BBB+ and below using the middle of Moody’s, S&P, and Fitch) are excluded, but Canadian and global bonds (SEC registered) of issuers in non-EMG countries are included.
- FTSE NAREIT Equity REITs Index contains all Equity REITs not designed as Timber REITs or Infrastructure REITs.
- Bloomberg Commodity Index is calculated on an excess return basis and reflects commodity futures price movements. The index rebalances annually weighted 2/3 by trading volume and 1/3 by world production and weight-caps are applied at the commodity, sector and group level for diversification.
Material Risks
- Fixed Income securities are subject to interest rate risks, the risk of default and liquidity risk. U.S. investors exposed to non-U.S. fixed income may also be subject to currency risk and fluctuations.
- Cash may be subject to the loss of principal and over longer periods of time may lose purchasing power due to inflation.
- Domestic Equity can be volatile. The rise or fall in prices take place for a number of reasons including, but not limited to changes to underlying company conditions, sector or industry factors, or other macro events. These may happen quickly and unpredictably.
- International Equity can be volatile. The rise or fall in prices take place for a number of reasons including, but not limited to changes to underlying company conditions, sector or industry impacts, or other macro events. These may happen quickly and unpredictably. International equity allocations may also be impact by currency and/or country specific risks which may result in lower liquidity in some markets.
- Real Assets can be volatile and may include asset segments that may have greater volatility than investment in traditional equity securities. Such volatility could be influenced by a myriad of factors including, but not limited to overall market volatility, changes in interest rates, political and regulatory developments, or other exogenous events like weather or natural disaster.
- Private Real Estate involves higher risk and is suitable only for sophisticated investors. Real estate assets can be volatile and may include unique risks to the asset class like leverage and/or industry, sector or geographical concentration. Declines in real estate value may take place for a number of reasons including, but are not limited to economic conditions, change in condition of the underlying property or defaults by the borrow.
The information contained herein is confidential and the dissemination or distribution to any other person without the prior approval of Fiducient Advisors is strictly prohibited. Information has been obtained from sources believed to be reliable, though not independently verified. Any forecasts are hypothetical and represent future expectations and not actual return volatilities and correlations will differ from forecasts. This report does not represent a specific investment recommendation. The opinions and analysis expressed herein are based on Fiducient Advisor research and professional experience and are expressed as of the date of this report. Please consult with your advisor, attorney and accountant, as appropriate, regarding specific advice. Past performance does not indicate future performance and there is risk of loss.