Key Observations
• Following two years of waning deal activity, the first half of 2024 has seen a promising rebound, with a year-over-year increase of 12%.1 Corporate carveouts and smaller add-on transactions remained particularly attractive to General Partners.
• The median fundraising timeline has stretched beyond 18 months, largely due to a shortage of distributions affecting Limited Partners’ capacity to commit to new funds.1 Nevertheless, high-conviction and appropriately sized funds continued to be oversubscribed, achieving rapid closings.
• Exit activity remained a significant challenge, with capital calls outpacing distributions for the third consecutive year. The emergence of continuation funds as a popular exit strategy reflects the industry’s adaptation to this dynamic. In addition, there has been discussion swirling at the largest end of the market as some companies may start to become ‘too big to exit’.
• There is a divergence in performance between mega funds and middle-market funds, the latter of which posted more compelling returns. This trend underscores the potential advantages of investing in the lower and middle market where funds often benefit from less leverage, greater operational agility and a broader range of exit options.
Introduction
In recent years, the private equity landscape has witnessed a dramatic evolution, characterized by both remarkable peaks and significant declines. Despite a backdrop of negative headlines, fundraising has shown resilience, with relatively steady capital inflows into both large-scale buyouts and middle-market funds. This contrasts with a fundraising slowdown in private debt and private real estate, strategies grappling with shifting investor interest. Private equity deal activity, while rebounding from previous lows, reveals a dynamic shift toward add-ons and corporate carveouts, underscoring a trend toward consolidation and strategic asset realignment. Meanwhile, exit activity remains a pressing concern, with continuation funds becoming a mainstream mechanism to address the gap between capital calls and distributions. As valuations fluctuate and performance diverges by strategy and fund size, this paper delves into the intricacies shaping private markets, offering insights into the evolving strategies and opportunities within this complex environment.
Fundraising
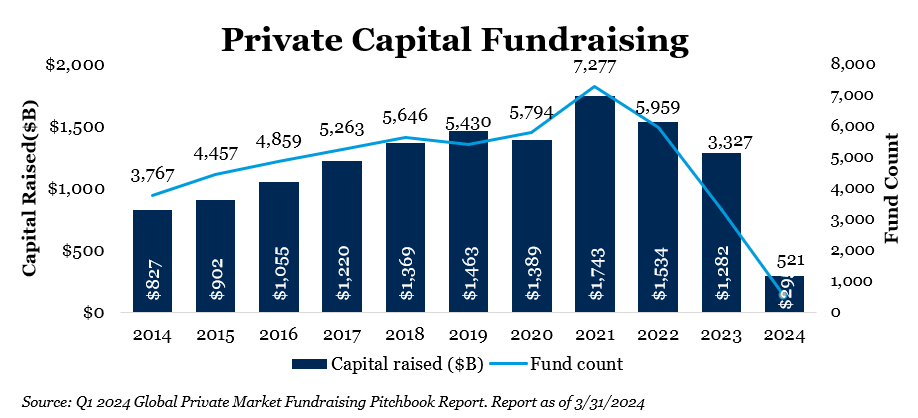
Fundraising in 2021 and 2022 was remarkably strong compared to historical averages, albeit dollars were more concentrated in fewer names, as has been the case in recent years. In the first quarter of 2024, 521 private market funds raised a total of $295 billion and while the dollar amount is on pace with 2023, the fund count is much smaller.2 Despite a slew of negative headlines surrounding private markets, some areas – private equity for example – remain particularly resilient. While others, such as private debt and real estate, are struggling to garner interest.
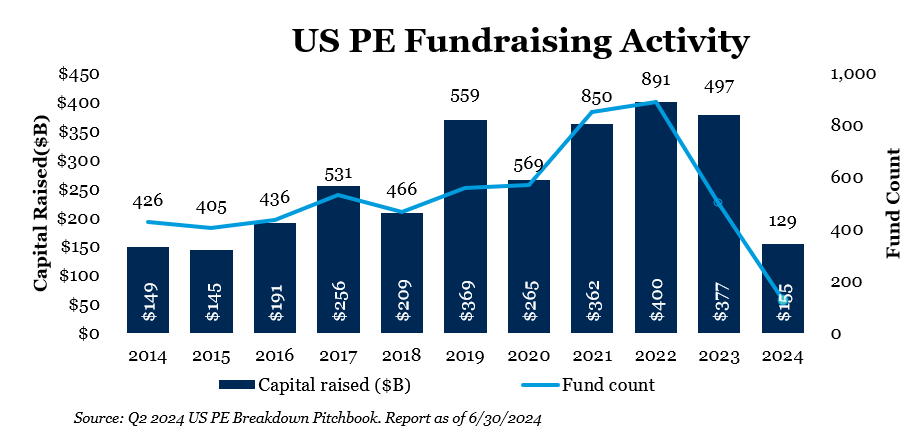
By the end of June, US private equity managers successfully secured $155 billion across 129 funds, with the majority of this capital concentrated in the buyout space. On the larger end, significant buyout fundraising—defined as funds raising $5 billion or more—has been bolstered by a few standout closes. Silver Lake wrapped up its latest flagship buyout fund at $20.5 billion, while Vista Equity Partners secured $20 billion.3 However, private equity fundraising typically lags behind market trends, and with fewer mega funds in the market compared to recent years, we may witness a fundraising dip in the latter half of 2024.
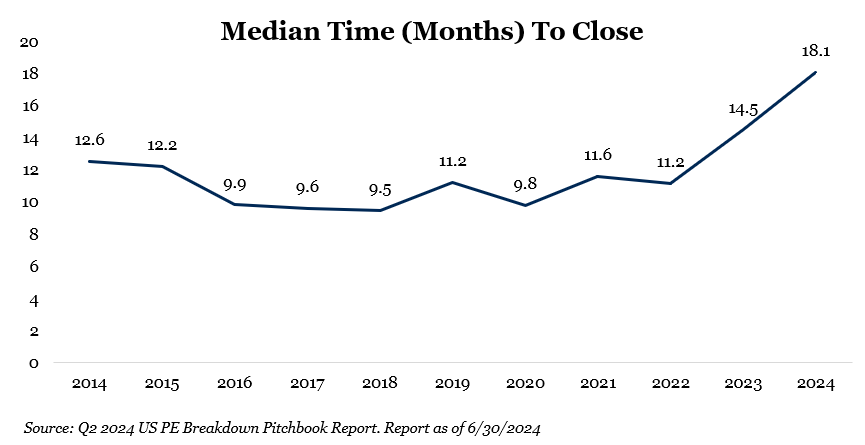
Despite the overall strength of the fundraising landscape, the median fundraising timeline has continued to stretch, now exceeding 18 months—up from 14.7 months in 2023 and 11.2 months in 2022.3 This elongation likely stems from a broader lack of distributions across the Limited Partners’ (LP) landscape.
Limited Partners’ capacity to commit to new funds is closely tied to the distributions they receive as cash inflows often drive subsequent investments, particularly in mature private equity programs. Anecdotally, we believe there is a link between the time it takes General Partners (GPs) to raise funds and the stability of their LP base coupled with a more thoughtful and disciplined fund size. The most attractive funds continue to draw strong interest and close quickly.
Deal Activity
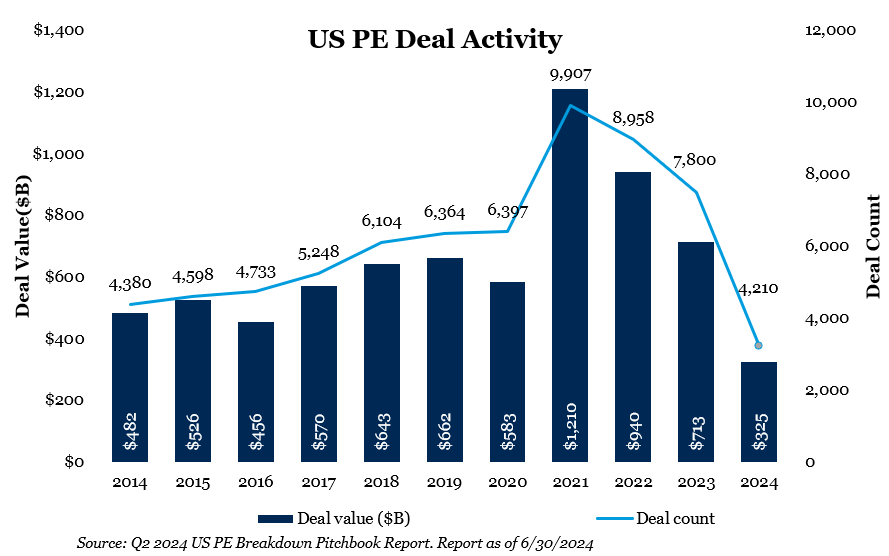
After two years of declining deal volume and activity, the first half of 2024 shows a promising rebound for US private equity deal activity. Pitchbook reported a 12% increase year-over-year, with deal values expected to surpass $375 billion across more than 4,000 transactions through June 2024. As we noted in our annual update earlier this year, this data suggests that the hyperactivity of 2021 was an anomaly, and 2024 is set to exceed the “normal” levels seen from 2014 to 2020, which ranged from $482.4 billion to $662.0 billion.4
Add-on transactions, referring to the acquisition of a smaller company by an existing portfolio company owned by a private equity firm, have been particularly noteworthy in the first half of the year, slightly exceeding 2023 levels and making up a significant 77.4% of all private equity buyouts.5 These smaller, often lower-multiple deals reflect the industry’s continued focus on operational synergies and consolidation.
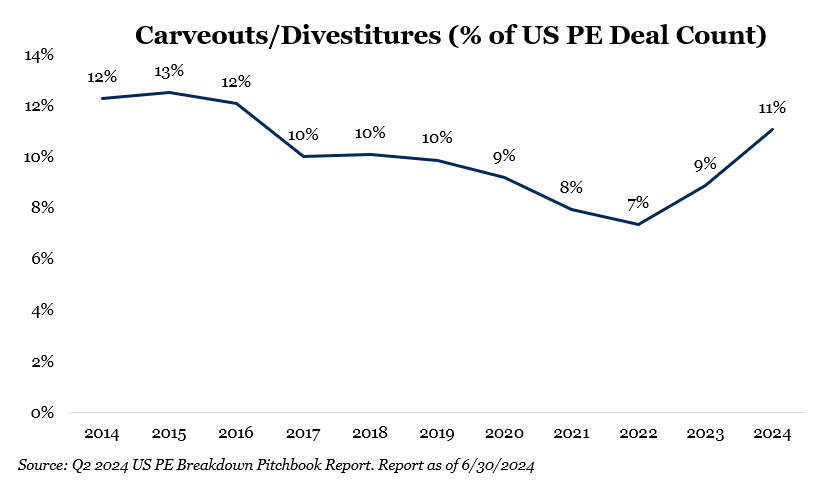
Additionally, large-scale companies are increasingly divesting non-core units through corporate carveouts, allowing for more streamlined business models and renewed investor engagement. GPs are particularly drawn to these carveout opportunities, with activity in this area growing since late 2021. In Q2 2024, carveouts accounted for 10.3% of all US PE buyout deals, down slightly from a peak of 11.7% in Q1 2024, the highest level in nearly a decade.5 Carveout transactions are complex, involving the transfer of assets such as buildings, equipment, intellectual property, employees and service agreements. GPs with expertise in navigating these challenges are keen to bid on such deals, aiming to transform neglected and undervalued assets into core businesses with significant growth potential.
Exit Activity
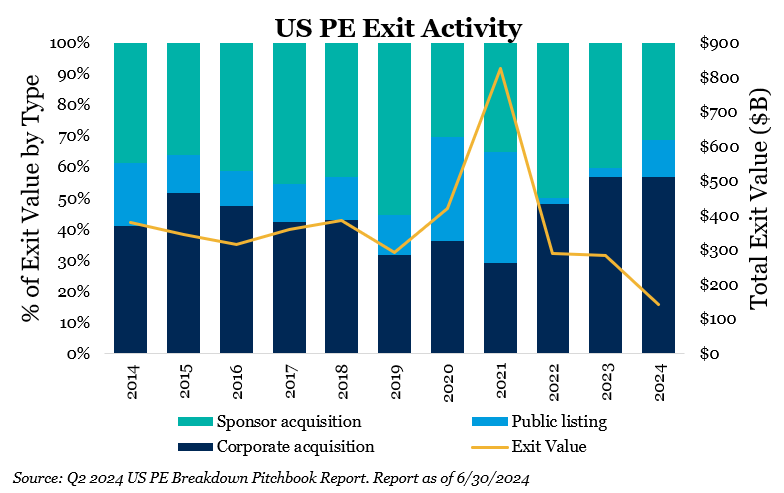
The lack of exit activity has become a pressing issue for private market participants, where capital calls have outpaced distributions in both 2022 and 2023.6 This shift is putting significant strain on both LPs and GPs. From 2011 to 2021, private equity enjoyed eleven straight years of net distributions to LPs, creating a positive liquidity environment. This abundance led to increased allocations to private markets and allowed GPs to raise funds more rapidly with substantial increases in size. However, the last two years have brought a dramatic change, flipping from net distributions to net capital calls.6 As a result, LP commitment budgets have been cut, casting a shadow over the private market fundraising landscape. Although US PE exit value saw a roughly 15% year-over-year increase in the first half of 2024, it still falls short—by more than 50%—of the exit volumes witnessed in 2020 and 2021.7
When it comes to fully realizing portfolio companies, there are several paths—public market exits, corporate acquisitions and sponsor-to-sponsor deals—but one increasingly popular route is continuation funds. In 2023, Pitchbook tracked around 80 exits through continuation funds, and the first half of 2024 is on pace to surpass that figure. Continuation funds offer a strategic solution by extending the exit timeline for portfolio companies that GPs wish to retain while also providing liquidity to LPs in commingled vehicles. Secondary vehicles are a key participant in continuation vehicles and the $81.6 billion raised in global secondaries strategies in 2023 will likely support a wave of single and multi-asset continuation vehicles coming to market in 2024.8
Real Assets and Debt
Raising capital has been a steep uphill battle for real estate and real assets funds this year. By the end of the first quarter, only 37 private real estate vehicles managed to secure $16.1 billion in commitments. At this pace, the asset class is on track to fall short of 2023’s $91.1 billion—a 12-year low.9 Certain core sectors like office remain severely challenged and out of favor, while others, such as industrials, continue to attract investor interest albeit not with the ferocity of prior years.
Successful capital raises have shown consistent trends: seasoned managers with deep sector expertise are drawing in the lion’s share of investments. Notably, funds that are fifth in their series or later captured 86.1% of commitments, with many of these funds ranging between $1 billion and $5 billion in size.9 In uncertain times, LPs tend to stick with familiar, long-term partners rather than take risks on emerging managers. While skepticism is a natural response, the current lack of interest and capital in private real assets could lead to more favorable deal structures and better value for managers who are equipped with fresh capital.
Similarly, private debt fundraising has also slowed, marking its weakest start to a year since 2016, despite years of being lauded as the darling of private markets. The first quarter saw just $30.4 billion in fund closures, a sharp drop from the $56.0 billion raised in Q1 2023.10 The narrative around interest rates and spreads has shifted dramatically since the start of the year. Intensified competition within the direct lending market has resulted in narrower spreads, and the anticipated decline in interest rates has lessened the potential for substantial returns from private credit investments compared to prior years.
Although banks have been gradually retreating from their usual lending tempo, there’s still a significant amount of private credit dry powder chasing a shrinking pool of deals, exacerbated by a decline in M&A activity. As of Q3 2023, 31.8% of the $525.6 billion in private credit dry powder is over three years old—the highest proportion since 2011.11 The combination of this dry powder with expectations of future rate cuts and an increasingly active broadly syndicated loan market suggests that future private credit allocations should be closely examined.
Venture Capital
Venture capital has become a focal point of discussion, especially with the hyperfocus on artificial intelligence and increased volatility since interest rates began rising in early 2022. Given the changing landscape, we find it crucial to revisit our perspective on venture capital – venture typically has longer hold periods, there is a flywheel effect in that entrepreneurs seek to partner with brand-name venture capitalists, early-stage rounds are more reasonably priced, and while return potential is high so is the risk profile. These insights shape our approach to investment pacing, portfolio construction, and GP selection, regardless of market conditions.
Looking at capital deployment trends in venture capital, the pace has slowed considerably since its peak in 2020. For example, funds raised in 2022 have deployed just 43% of their committed capital within two years—the lowest of any vintage analyzed—compared to 47% to 60% for earlier vintages at the same mark.12 This mirrors a broader trend in private markets, where venture capitalists are adopting a more cautious approach to investing. As such, we anticipate that the time it takes for these funds to return to the fundraising market will be extended. This is already evident as the year-over-year change in venture capital fundraising as of Q1 2024 is -40.9%.13
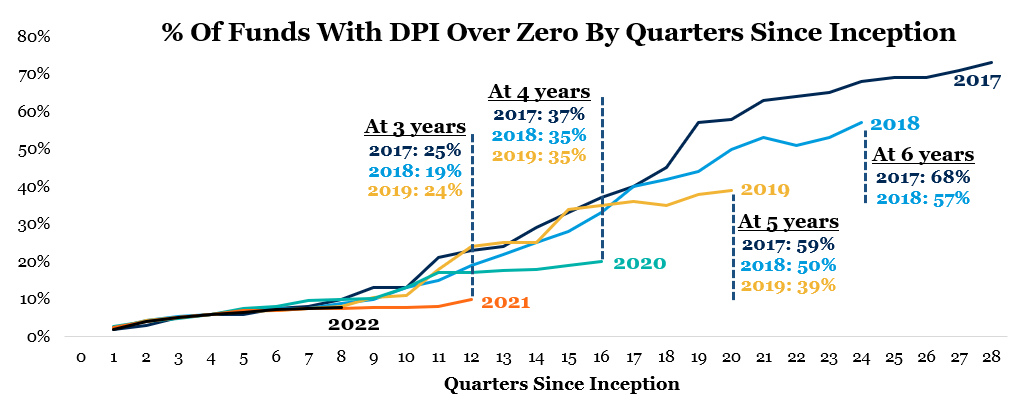
Equally important, if not more so, is the lag in distributions to LPs, which have fallen short of historical norms. In the early stages, venture fund managers focus more on making new investments and adding value to portfolio companies than on securing exits. However, LPs are increasingly prioritizing DPI (Distribution to Paid-In Capital) as a key metric for evaluating new and existing fund relationships. It is telling that fewer recent vintages have achieved DPI milestones compared to older funds. For instance, only 9% of funds from the 2021 vintage have returned any capital to LPs at the three-year mark, compared to 25% of the 2017 vintage.14
What has been the fallout for startups and entrepreneurs amid sluggish capital deployment, delayed distributions and lackluster performance? Since 2019, the gaps between fundraising rounds have been stretching longer and longer, pushing founders to think creatively on extending their runway through slimmer operations and more structured financing rounds. If there is a bright spot, it is the start-up world of artificial intelligence and machine learning, with company valuations heavily exceeding those in other verticals, receiving nearly 50% of deal value in the US market last quarter.15 While we’re confident the best and brightest businesses will rise to the occasion, the path ahead promises to be anything but smooth.
Valuations and Performance
Private equity valuations, which soared to their zenith in 2021, saw a significant downturn in 2022 and 2023, plummeting by 20% to 30% depending on the metric—be it EBITDA or revenue.16 However, the first half of 2024 has taken a different trajectory. The median EV/EBITDA multiple on PE deals for the trailing 12-month period ending Q2 2024 climbed to 12.4x, up from 11.9x in Q1 2024.16 Despite the still-muted pace of dealmaking, this increase may reflect managers bringing their most coveted assets to market, where there’s a higher likelihood of securing a robust bid. This upward trend hasn’t been mirrored in EV/Revenue multiples, which dipped slightly to 1.9x from 2.0x in 2023.16 These multiples typically represent a broader array of companies, especially within the tech sector, where EBITDA metrics are less common. It remains to be seen whether today’s more modest valuations will become the new norm.
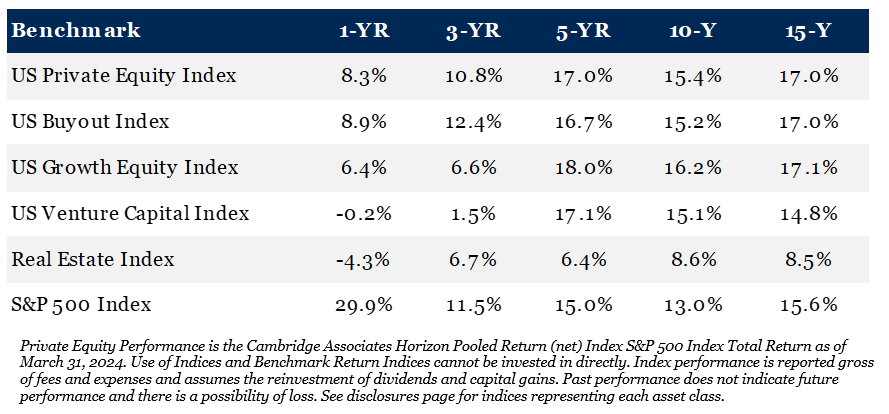
In terms of performance, nearly all strategies kicked off 2024 on a positive note, with the exception of real estate.16 While returns across private markets remain subdued compared to historical averages, there is a growing sense of optimism, providing some reassurance—albeit contingent on one’s faith in private market valuations. Zooming in on private equity, a stark divergence in performance emerges based on fund size. Mega funds continue to lag behind smaller funds, despite commanding nearly half of LP commitments. These colossal funds are now entering their seventh consecutive quarter of single-digit rolling one-year returns, a sharp contrast to the 40 consecutive quarters of double-digit returns they enjoyed previously. Middle market funds, ranging from $100 million to $5 billion, have posted more compelling returns.16 This could be attributed to a variety of factors: smaller funds generally rely less on leverage, have greater agility in executing operational improvements, and possess a broader range of exit options in the upper market. Simply put, they have more pathways to success. This data reinforces our belief in concentrating client investments within the lower and middle market.
Outlook
Reflecting on the first half of 2024, it is evident that many of the macroeconomic and market dynamics that defined 2023 have persisted. Fundraising and dealmaking have returned to more grounded levels, prompting allocators to reconsider their long-term strategies in private markets, which require a horizon of ten plus years. Despite the inevitable ebb and flow, with periods of volatility rippling through various strategies, these fluctuations often unveil compelling opportunities for both GPs and LPs. Our ongoing reassessment of critical themes—such as valuations, illiquidity and capital supply—helps us pinpoint promising risk-reward areas within the private market landscape. From our perspective, while challenges persist, the outlook remains optimistic.
To discover the potential of private markets and start strategically building out your portfolio today, kindly contact the professionals at Fiducient Advisors for further details.
1, 3, 4, 5, 7Q2 2024 US PE Breakdown Pitchbook Report
2, 15Pitchbook Q1 2024 Private Market Fundraising Report
6Lexington Partners Secondary Market Landscape as of Q4 2023, page 9
8Q2 2024 Pitchbook US PE Breakdown
9, 10Q1 2024 Global Private Market Fundraising Report
11Pitchbook Q2 2024 Allocator Solutions report
12, 14Carta VC Fund Performance data as of Q1 2024
13Pitchbook Q1 2024 Private Market Fundraising Report
16Q2 2024 US PE Breakdown
Index Definitions and Disclosures
Comparisons to any indices referenced herein are for illustrative purposes only and are not meant to imply that actual returns or volatility will be similar to the indices. Indices cannot be invested in directly. Unmanaged index returns assume reinvestment of any and all distributions and do not reflect our fees or expenses.
S&P 500 Index is a capitalization-weighted index designed to measure performance of the broad domestic economy through changes in the aggregate market value of 500 stocks representing all major industries.
Real Estate Index is a horizon calculation based on data compiled from 1,305 real estate funds, including fully liquidated partnerships, formed between 1986 and 2022.
US Venture Capital Index is a horizon calculation based on data compiled from 2,322 US venture capital funds, including fully liquidated partnerships, formed between 1981 and 2022.
US Growth Equity Index is a horizon calculation based on data compiled from 412 US growth equity funds, including fully liquidated partnerships, formed between 1986 and 2022.
US Buyout Index is a horizon calculation based on data compiled from 1,070 US buyout funds, including fully liquidated partnerships, formed between 1986 and 2022.
US Private Equity Index is a horizon calculation based on data compiled from 1,482 US private equity funds, including fully liquidated partnerships, formed between 1986 and 2022.
Material Risk Disclosures
Cash may be subject to the loss of principal and over longer period of time may lose purchasing power due to inflation.
Real Assets can be volatile and may include asset segments that may have greater volatility than investment in traditional equity securities. Such volatility could be influenced by a myriad of factors including, but not limited to overall market volatility, changes in interest rates, political and regulatory developments, or other exogenous events like weather or natural disaster.
Private Equity involves higher risk and is suitable only for sophisticated investors. Along with traditional equity market risks, private equity investments are also subject to higher fees, lower liquidity and the potential for leverage that may amplify volatility and/or the potential
loss of capital.
Private Credit involves higher risk and is suitable only for sophisticated investors. These assets are subject to interest rate risks, the risk of default and limited liquidity. U.S. investors exposed to non-U.S. private credit may also be subject to currency risk and fluctuations.
Private Real Estate involves higher risk and is suitable only for sophisticated investors. Real estate assets can be volatile and may include unique risks to the asset class like leverage and/or industry, sector or geographical concentration. Declines in real estate value may take place
for a number of reasons including, but are not limited to economic conditions, change in condition of the underlying property or defaults by the borrow.
Comparisons to any indices referenced herein are for illustrative purposes only and are not meant to imply that actual returns or volatility will be similar to the indices. Indices cannot be invested in directly. Unmanaged index returns assume reinvestment of any and all distributions and do not reflect our fees or expenses.
The information contained herein is confidential and the dissemination or distribution to any other person without the prior approval of Fiducient Advisors is strictly prohibited. Information has been obtained from sources believed to be reliable, though not independently verified. Any forecasts are hypothetical and represent future expectations and not actual return volatilities and correlations will differ from forecasts. This report does not represent a specific investment recommendation. The opinions and analysis expressed herein are based on Fiducient Advisor research and professional experience and are expressed as of the date of this report. Please consult with your advisor, attorney and accountant, as appropriate, regarding specific advice. Past performance does not indicate future performance and there is risk of loss.